How to Capture Kubernetes pods packets using tcpdump and Wireshark. Troubleshooting Kubernetes containers is a come-and-go topic that you may face from time to time. In Kubernetes, you can get insights about the containers using the kubectl commands that include kubectl logs, kubectl describe, kubectl exec e.t.c. However, there are cases when these tools do not provide enough information. There is where monitoring and logging tools come in. They help you understand better what is happening in your cluster or containers.
Ksniff, shipped as a kubectl plugin allows one to capture traffic on specified pods in the cluster using tcpdump and Wireshark. It works by using kubectl to upload a packet sniffer(compiled tcpdump binary) to the targetted container and redirects the output to a local Wireshark instance.
Wireshark can be defined as a graphical network packet analyzing tool based on pcap(API for network packet capture). Using this tool, you can easily perform analysis by protocol filtering, port, and many other packet attributes.
In This guide which provides the knowledge on how to capture Kubernetes pods packets using tcpdump and Wireshark.
Getting Started.
Begin by installing the required packages:
##On Rhel/CentOS/Rocky Linux/Alma Linux
sudo yum -y install git

##On Ubuntu/Debian
sudo apt update
sudo apt -y install git
I assume you already have a Kubernetes cluster already set up. This site provides several ways one can use to set up a Kubernetes cluster.
- Deploy Kubernetes Cluster on Linux With k0s
- Run Kubernetes on Debian with Minikube
- Install Kubernetes Cluster on Ubuntu using K3s
- Install Kubernetes Cluster on Rocky Linux 8 with Kubeadm & CRI-O
After the cluster has been set up, you need kubectlinstalled.
curl -LO "https://storage.googleapis.com/kubernetes-release/release/$(curl -s https://storage.googleapis.com/kubernetes-release/release/stable.txt)/bin/linux/amd64/kubectl"
chmod +x kubectl
sudo mv kubectl /usr/local/bin
On k0s, you need to export the admin.conf to be able to access the cluster.
export KUBECONFIG=/var/lib/k0s/pki/admin.confStep 1 – Instal Krew on Your System
Ksniff can be easily installed using Krew. We will begin by installing Krew using the command below.
(
  set -x; cd "$(mktemp -d)" &&
  OS="$(uname | tr '[:upper:]' '[:lower:]')" &&
  ARCH="$(uname -m | sed -e 's/x86_64/amd64/' -e 's/\(arm\)\(64\)\?.*/\1\2/' -e 's/aarch64$/arm64/')" &&
  KREW="krew-${OS}_${ARCH}" &&
  curl -fsSLO "https://github.com/kubernetes-sigs/krew/releases/latest/download/${KREW}.tar.gz" &&
  tar zxvf "${KREW}.tar.gz" &&
  ./"${KREW}" install krew
)
Export the Krew PATH environment variable by adding the below lines to your .bashrc or .zshrc file
export PATH="${KREW_ROOT:-$HOME/.krew}/bin:$PATH"source the profile.
source ~/.bashrc
##OR
source ~/.zshrc
For Fish
Execute the below command on your terminal.
begin
  set -x; set temp_dir (mktemp -d); cd "$temp_dir" &&
  set OS (uname | tr '[:upper:]' '[:lower:]') &&
  set ARCH (uname -m | sed -e 's/x86_64/amd64/' -e 's/\(arm\)\(64\)\?.*/\1\2/' -e 's/aarch64$/arm64/') &&
  set KREW krew-$OS"_"$ARCH &&
  curl -fsSLO "https://github.com/kubernetes-sigs/krew/releases/latest/download/$KREW.tar.gz" &&
  tar zxvf $KREW.tar.gz &&
  ./$KREW install krew &&
  set -e KREW; set -e temp_dir
end
Export your PATH environment variable.
set -gx PATH $PATH $HOME/.krew/binRestart the shell.
Once complete, verify the Krew installation using the command:
$ kubectl krew
krew is the kubectl plugin manager.
You can invoke krew through kubectl: "kubectl krew [command]..."

Usage:
  kubectl krew [command]

Available Commands:
  completion  generate the autocompletion script for the specified shell
  help        Help about any command
  index       Manage custom plugin indexes
  info        Show information about an available plugin
  install     Install kubectl plugins
  list        List installed kubectl plugins
  search      Discover kubectl plugins
  uninstall   Uninstall plugins
  update      Update the local copy of the plugin index
  upgrade     Upgrade installed plugins to newer versions
  version     Show krew version and diagnostics

Flags:
  -h, --help      help for krew
  -v, --v Level   number for the log level verbosity

Use "kubectl krew [command] --help" for more information about a command.
Step 2 – Install Ksniff plugin using krew
Once Krew has been installed, use it to install Ksniff with the command:
kubectl krew install sniffSample execution output:
Installing plugin: sniff
Installed plugin: sniff
\
 | Use this plugin:
 | 	kubectl sniff
 | Documentation:
 | 	https://github.com/eldadru/ksniff
 | Caveats:
 | \
 |  | This plugin needs the following programs:
 |  | * wireshark (optional, used for live capture)
 | /
/
Step 3 – Install Wireshark Application
The Wireshark application is installed on your local system. There are several dedicated guides to help you achieve this.
- How To Install Wireshark on Debian
- Install Wireshark on Ubuntu Desktop
On CentOS/Rocky Linux/Alma Linux, you can use the below command to install Wireshark for Gnome.
sudo yum install wireshark wireshark-gnomeYou also need to make configurations for Wireshark to be able to capture the packets as a normal user.
First, add the user to the Wireshark group.
sudo usermod -a -G wireshark $USERSet the right permission for the dumpcap binary file.
sudo chgrp wireshark /usr/bin/dumpcap
sudo chmod 750 /usr/bin/dumpcap
sudo setcap cap_net_raw,cap_net_admin=eip /usr/bin/dumpcap
Verify the changes made.
$ sudo getcap /usr/bin/dumpcap
/usr/bin/dumpcap cap_net_admin,cap_net_raw=eip
Step 4 – Capture Kubernetes pods packets
To be able to capture the Kubernetes pods packets using tcpdump and Wireshark, a command with the syntax below is used.
kubectl plugin sniff <POD_NAME> [-n <NAMESPACE_NAME>] [-c <CONTAINER_NAME>] --image <PRIVATE_REPO>/docker --tcpdump-image <PRIVATE_REPO>/tcpdumpNon-Privileged and Scratch Pods
To be able to reduce the attack surface, many containers in a production environment run as non-privileged users or scratch containers.
Ksniff supports those containers by shipping the-p (privileged) flag. When the -p flag is used, Ksniff creates a new pod on the remote cluster that has access to the node docker daemon. The pod is then used to execute a container attached to the target container namespace and performs the network capture.
This guide demonstrates packet capture by setting up a demo Apache application container using helm.
Now use helm to deploy the application.
helm repo add bitnami https://charts.bitnami.com/bitnami
helm install web-server bitnami/apache
Ensure the pod is running:
$ kubectl get pods
NAME                                 READY   STATUS    RESTARTS   AGE
web-server-apache-6cfbd8d7cb-55p2c   0/1     Running   0          10s
Expose the service.
$ kubectl get svc
NAME                TYPE           CLUSTER-IP      EXTERNAL-IP   PORT(S)                      AGE
kubernetes          ClusterIP      10.96.0.1       <none>        443/TCP                      3m36s
web-server-apache   LoadBalancer   10.97.149.202   <pending>     80:30338/TCP,443:30040/TCP   36s
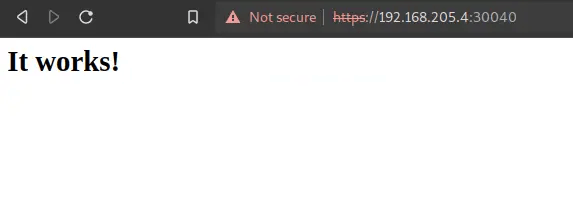
Verify if the server is accessible using the HTTP port 30338. or HTTPS port 30040

Now perform a packet capture with the command:
kubectl sniff <your-pod-name> -p -n <namespace>Since the pod is in the default namespace, the command will be as below:
kubectl sniff -p web-server-apache-6cfbd8d7cb-55p2cOn k0s, k3s e.t.c, you may get an error “MountVolume.SetUp failed for volume “container-socket” : hostPath type check failed“. You need to specify the socket as below:
##On K0s
kubectl sniff -p web-server-apache-6cfbd8d7cb-55p2c --socket /run/k0s/containerd.sock

##On K3s
kubectl sniff -p web-server-apache-6cfbd8d7cb-55p2c --socket /run/k3s/containerd/containerd.sock
Sample output:
INFO[0000] no container specified, taking first container we found in pod.
INFO[0000] selected container: 'apache'
INFO[0000] sniffing method: privileged pod
INFO[0000] sniffing on pod: 'web-server-apache-6cfbd8d7cb-55p2c' [namespace: 'default', container: 'apache', filter: '', interface: 'any']
INFO[0000] creating privileged pod on node: 'ubuntu'
INFO[0000] pod: 'ksniff-flrv9' created successfully in namespace: 'default'
INFO[0000] waiting for pod successful startup
INFO[0006] pod: 'ksniff-flrv9' created successfully on node: 'ubuntu'
INFO[0006] spawning wireshark!
INFO[0006] starting remote sniffing using privileged pod
INFO[0006] executing command: '[/bin/sh -c
    set -ex
    export CONTAINERD_SOCKET="/run/k0s/containerd.sock"
    export CONTAINERD_NAMESPACE="k8s.io"
    export CONTAINER_RUNTIME_ENDPOINT="unix:///host${CONTAINERD_SOCKET}"
    export IMAGE_SERVICE_ENDPOINT=${CONTAINER_RUNTIME_ENDPOINT}
    crictl pull docker.io/maintained/tcpdump:latest >/dev/null
    netns=$(crictl inspect 39c5bab4a072138d1d2fb9f7442b048c745fe4d7586d051758ea6ef340f9038f | jq '.info.runtimeSpec.linux.namespaces[] | select(.type == "network") | .path' | tr -d '"')
    exec chroot /host ctr -a ${CONTAINERD_SOCKET} run --rm --with-ns "network:${netns}" docker.io/maintained/tcpdump:latest ksniff-container-gxGgkomy tcpdump -i any -U -w -
    ]' on container: 'ksniff-privileged', pod: 'ksniff-flrv9', namespace: 'default'
INFO[0006] starting sniffer cleanup
INFO[0006] removing privileged container: 'ksniff-privileged'
INFO[0006] executing command: '[/bin/sh -c
......
INFO[0006] privileged container: 'ksniff-privileged' removed successfully
INFO[0006] removing pod: 'ksniff-flrv9'
INFO[0006] removing privileged pod: 'ksniff-flrv9'
INFO[0006] privileged pod: 'ksniff-flrv9' removed
INFO[0006] pod: 'ksniff-flrv9' removed successfully
INFO[0006] sniffer cleanup completed successfully
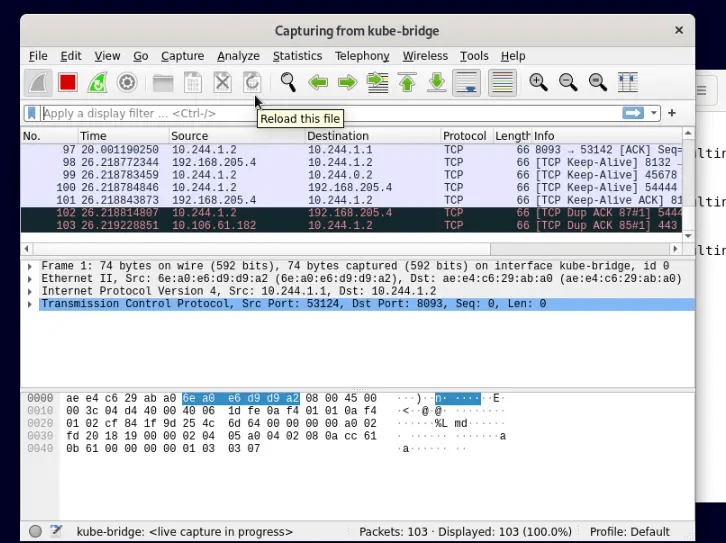
On Wireshark, you should be able to see the capture as below.

You can as well capture the traffic directed to a specific port say 8080 in your container with the command:
kubectl sniff <your-apache-pod-name> -f "port 8080" -pPiping output to stdout
Normally, Ksniff will start a Wireshark GUI instance. However, you can integrate it with other tools using the -o flag to pipe the data to stdout.
For example, saving the output to pcap file rather than real-time capturing, the command will be.
kubectl sniff <your-apache-pod-name> -p -o dns.pcapYou should have a dns.pcap file generated after the command.
You can also integrate it with tshark.
kubectl sniff pod-name -f "port 80" -o - | tshark -r -Voila!
That is it. We have successfully walked through how to capture Kubernetes pods packets using tcpdump and Wireshark. I hope this was significant to you.


