
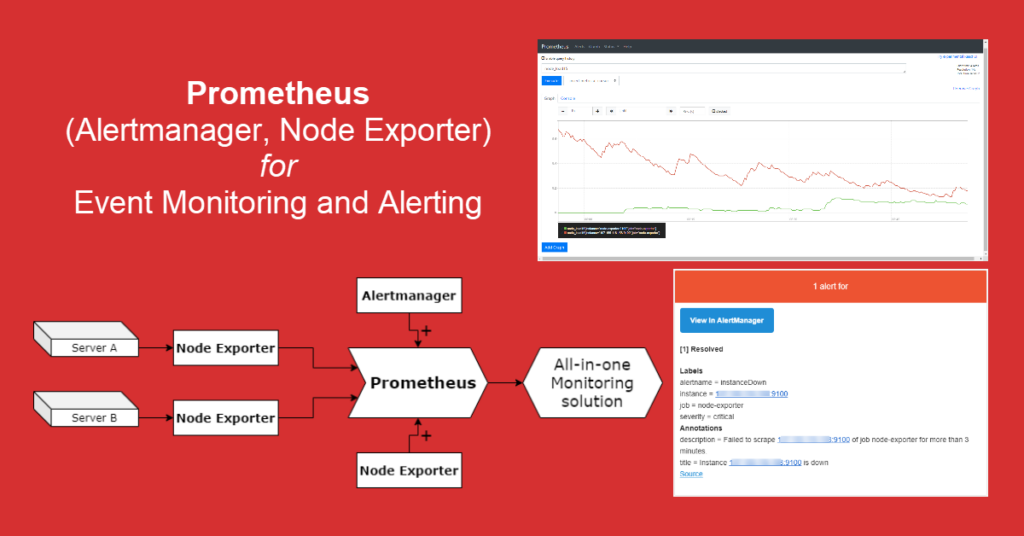
How to configure Prometheus Email Alert Notification using Alertmanager. Prometheus is a free and open-source event monitoring and alerting tool. It was first developed by SoundCloud in 2012.
Prometheus is widely used for time-series data monitoring and alerting. One of the most important parts of alerting is the capacity to send out meaningful notifications for alerts. Prometheus uses Alertmanager for notification.
Alertmanager processes alerts sent by Prometheus server and dispatches notifications to endpoints like email, Slack or other messaging platforms or services. This article will walk through the essential steps required to configure Prometheus email alert notification using Alertmanager.
To configure Prometheus email alert notification, you will first need to download and install Alertmanager on your machine. Then, you will need to create a configuration file for Alertmanager and point Prometheus to it. This configuration file can define alert notification templates, routing and retrying of alerts. After this is done, you will need to configure Alertmanager with a suitable SMTP server, such as Gmail or SendGrid, in order to send email notifications.
Once the SMTP server is configured, you can now define receivers and the type of notifications you want to send. You can define receivers as an array of email addresses and enable different types of notification such as CPU load alerts, disk space notifications, etc.
You can also define the severity and alert frequency through the configuration file. The last step is to test the configuration and ensure that the emails are being sent properly.
By following these steps, you should be able to configure Prometheus email alert notification using Alertmanager. The process is relatively straightforward, and the results are certainly worth the effort. With the ability to receive timely and consistent alert notifications, you will be able to monitor and maintain the health of your applications or systems more effectively.
Prometheus works by collecting and storing time series data. This numeric quantification varies from time to time and so, the data collected is saved with a timestamp. Prometheus is preferred because it offers the following cool features:
- Single server nodes are autonomous and don’t rely on distributed storage
- Targets are discovered via service discovery or static configuration
- The time-series metrics collection happens via a pull model over HTTP
- Supports multiple graphing and dashboarding modes.
- It uses the PromQL query language which is flexible to leverage this dimensionality.
- Multi-dimensional data model where time series data is identified by metric name and key/value pairs
Configuring alerting on Prometheus is vital as it can help identify performance and health issues for your server or applications as soon as they occur. Alertmanager is the application that handles the alerts sent by the applications and notifies the user via E-mail, Slack, or other tools. Alert rules defined in Prometheus are taken into consideration when scraping metrics. If any of the alert conditions are hit depending on the rules, Prometheus pushes them to the AlertManager.
The Alertmanager can handle grouping, deduplication, and routing of alerts to the correct receiver. It manages alerts through its pipelines, which are:
- Silencing: mutes alerts for a given period
- Grouping: groups alerts of similar nature into a single notification to avoid sending multiple notifications.
- Inhibition: suppresses specific alerts if other alerts are already fired.
Now let’s dive in and configure the AlertManager.
Before we Begin
This guide requires you to have Prometheus installed on your system. This can be accomplished using the guides below:
- On Ubuntu
- Install Prometheus Server on Ubuntu
- On Debian
- Install Prometheus and node_exporter on Debian
- On RHEL 9/CentOS 9/Rocky Linux 9/Alma Linux 9
- Install Prometheus with Node Exporter on Rocky Linux 9/AlmaLinux 9
- On RHEL 8/CentOS 8/Rocky Linux 8/Alma Linux 8
- How To Install Prometheus on RHEL 8 / CentOS 8
#.1 Install AlertManager on Linux
We will begin by installing the AlertManager to handle grouping, deduplication, and routing of alerts for Prometheus. Download AlertManager from the Prometheus download page.
It is also possible to pull the archive with wget.
First, export the latest version:
VER=${curl -s https://api.github.com/repos/prometheus/alertmanager/releases/latest|grep tag_name|cut -d '"' -f 4|sed 's/v//'}Now download the version with the command;
wget https://github.com/prometheus/alertmanager/releases/download/v${VER}/alertmanager-${VER}.linux-amd64.tar.gzExtract the archive:
tar xzf alertmanager-*.linux-amd64.tar.gzCopy the binary files to your $PATH;
sudo cp alertmanager-$VER.linux-amd64/{alertmanager,amtool} /usr/local/bin/Create a user to manage the AlertManager service:
sudo adduser -M -r -s /sbin/nologin alertmanagerCreate a configuration file for AlertManager with the correct ownership:
sudo mkdir -p /etc/alertmanager/data
sudo cp alertmanager-$VER.linux-amd64/alertmanager.yml /etc/alertmanager/
sudo chown -R alertmanager: /etc/alertmanager
#2. Configure AlertManager on Linux
Once installed, we need to configure AlertManager to handle the alerts from Prometheus. To do this, we will edit the configuration file as shown:
sudo vim /etc/alertmanager/alertmanager.ymlIn the file, make the below adjustments:
route:
  group_by: ['alertname']
  group_wait: 30s
  group_interval: 5m
  repeat_interval: 1m
  receiver: 'email'
receivers:
  - name: 'web.hook'
    webhook_configs:
      - url: 'http://127.0.0.1:5001/'
  - name: 'email'
    email_configs:
    - to: '[email protected]'
      from: '[email protected]'
      smarthost: smtp.gmail.com:587
      auth_username: '[email protected]'
      auth_identity: '[email protected]'
      auth_password: 'google-app-password'
      send_resolved: true
inhibit_rules:
  - source_match:
      severity: 'critical'
    target_match:
      severity: 'warning'
    equal: ['alertname', 'dev', 'instance']
In the above file:
- repeat_interval tells the AlertManager to wait for the set time before sending another notification. The default value is 1 hour, but you can adjust it as desired.
- receiver: ’email’ sets the default receiver to be used. For this tutorial, we have set the default receiver as email.
- receivers: lists the available receivers with their configurations. for example web.hook and email as above
Remember the email for the sender and receiver can be the same Gmail address for example, [email protected]. I will demonstrate later how to obtain the google-app-password
Once the correct email details have been provided, save the file and validate it with the command:
$ amtool check-config /etc/alertmanager/alertmanager.yml
Checking '/etc/alertmanager/alertmanager.yml'  SUCCESS
Found:
Found:
 - global config
 - route
 - 1 inhibit rules
 - 2 receivers
 - 0 templates
Now create a systemd service file for AlertManager;
sudo vim /etc/systemd/system/alertmanager.serviceAdd the below lines to the file:
[Unit]
Description=AlertManager Server Service
Wants=network-online.target
After=network-online.target

[Service]
User=alertmanager
Group=alertmanager
Type=simple
ExecStart=/usr/local/bin/alertmanager --config.file /etc/alertmanager/alertmanager.yml --storage.path=/etc/alertmanager/data

[Install]
WantedBy=multi-user.target
Save the file and reload systemd configurations
sudo systemctl daemon-reloadOn Rhel-based systems, modify SELinux as shown;
sudo /sbin/restorecon -v /usr/local/bin/alertmanagerStart and enable the service:
sudo systemctl enable --now alertmanagerVerify if the service is running:
$ systemctl status alertmanager
● alertmanager.service - AlertManager Server Service
     Loaded: loaded (/etc/systemd/system/alertmanager.service; enabled; vendor preset: disabled)
     Active: active (running) since Wed 2022-09-07 11:28:03 CEST; 3s ago
   Main PID: 91886 (alertmanager)
      Tasks: 6 (limit: 23441)
     Memory: 15.8M
        CPU: 55ms
     CGroup: /system.slice/alertmanager.service
             └─91886 /usr/local/bin/alertmanager --config.file /etc/alertmanager/alertmanager.yml --storage.path=/etc/alertmanager/data
#3. Configure Prometheus for Alerting
Now we will configure Prometheus by creating the alert rule. To do this, edit the configuration file as shown;
sudo vim /etc/prometheus/prometheus.ymlIn the configuration file, add the lines below:
# my global config
global:
  scrape_interval: 15s # Set the scrape interval to every 15 seconds. Default is every 1 minute.
  evaluation_interval: 15s # Evaluate rules every 15 seconds. The default is every 1 minute.
  # scrape_timeout is set to the global default (10s).

# Alertmanager configuration
alerting:
  alertmanagers:
  - static_configs:
    - targets:
       - localhost:9093

# Load rules once and periodically evaluate them according to the global 'evaluation_interval'.
rule_files:
   - "alert_rules.yml"
Save the file and create the Prometheus alert rules(alert_rules.yml) as specified in the configuration.
sudo vim /etc/prometheus/alert_rules.ymlIn the file, define the desired rules:
groups:
- name: alert_rules
  rules:
   - alert: InstanceDown
     expr: up == 0
     for: 1m
In the above file, we have configured an alert rule for targets – postgres_exporter already configured. To configure the target, you can use any of the guides below:
From the Prometheus dashboard, you will realize that, when a target is up, the state is 1 and when it is done, the state is 0. To confirm this, execute the command below.
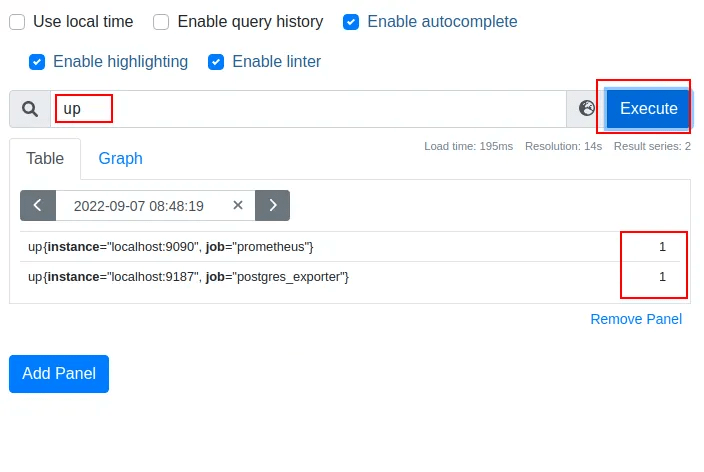
So for this guide, we have configured Prometheus to send send alerts if a target is down (with state 0) for 1 minute.
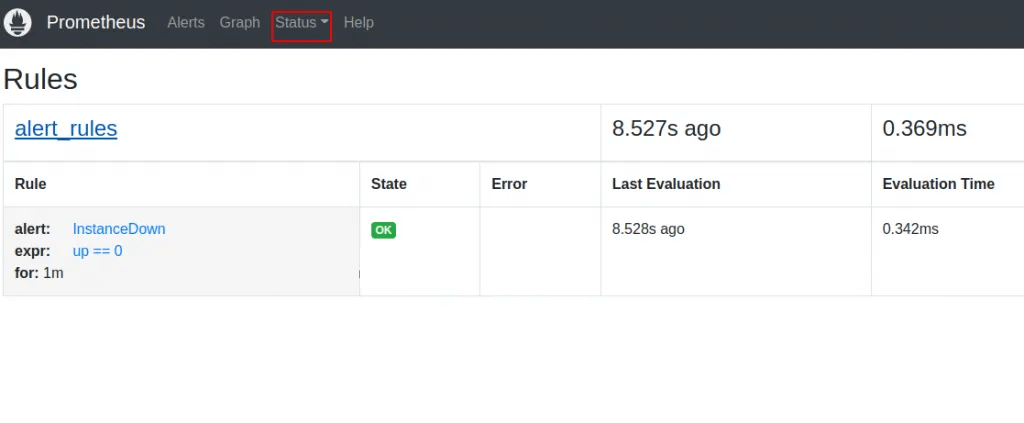
For the rules to apply, restart Prometheus:
sudo systemctl restart prometheusFrom the Prometheus web UI, under Status->Rules, you should see the added rules.
#4. Configure Gmail Receiver for AlertManager
To be able to receive notifications on the provided Gmail address. You need to generate the App password for AlertManager.
To do this, access your Gmail account and navigate to Security > App passwords as shown.
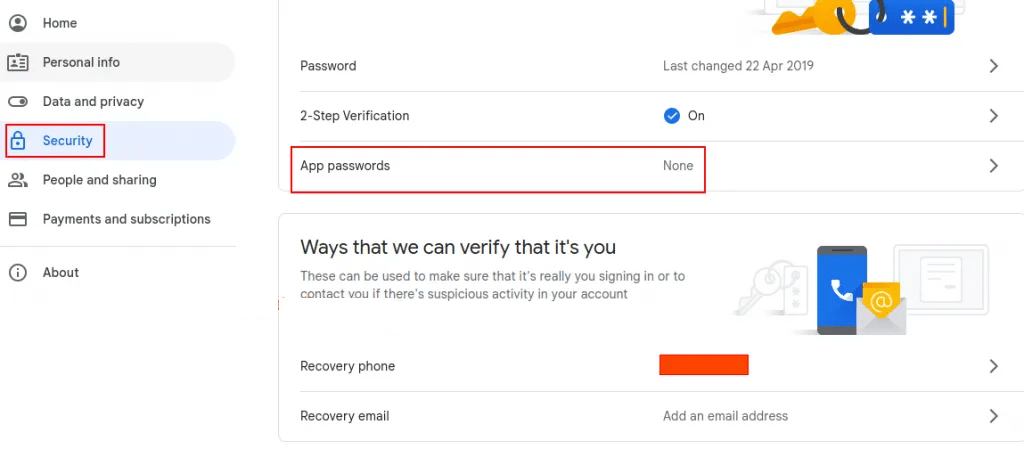
Once you have clicked on App passwords, select the applications as Mail from the drop-down menu.
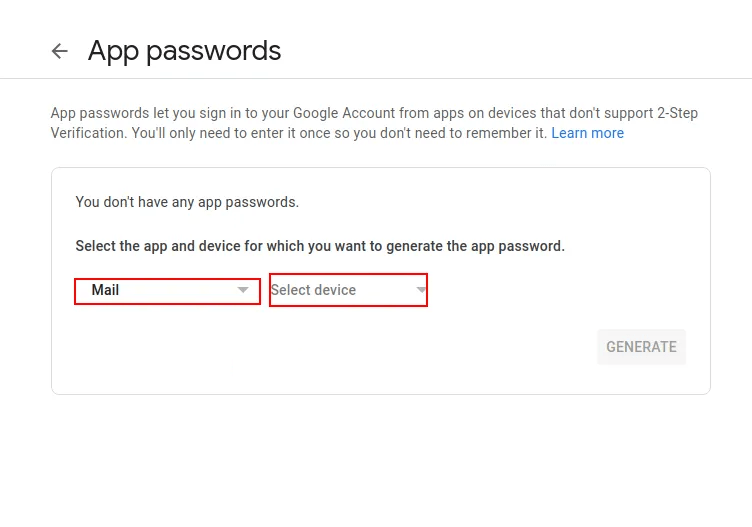
For the device, select Other (Custom name) and provide the name as alertmanager or any other name preferred.
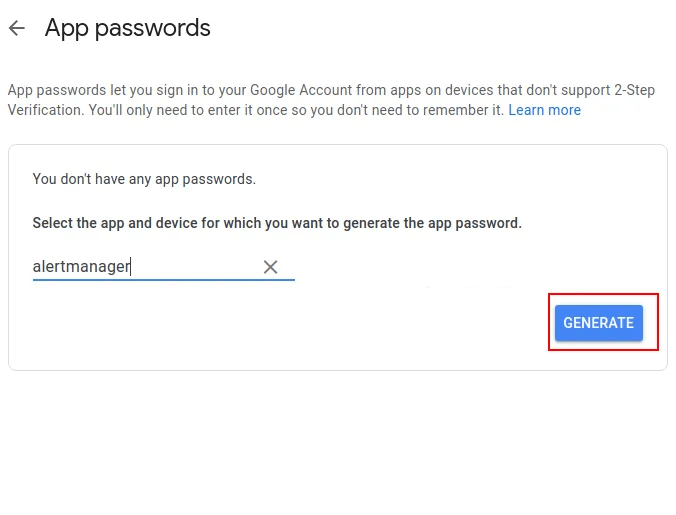
Now generate the password for the application.
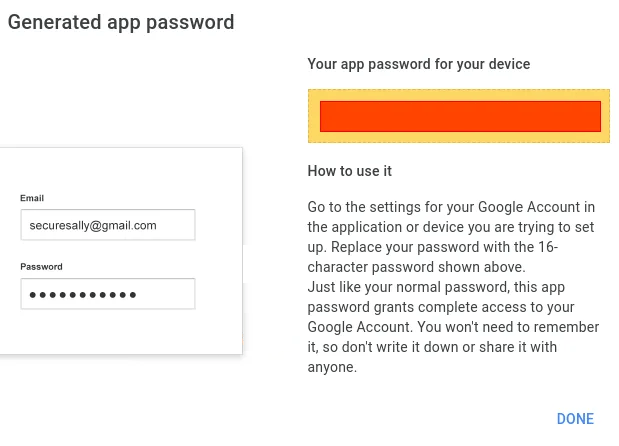
Once generated. you need to copy this password since it will be required in the below step.
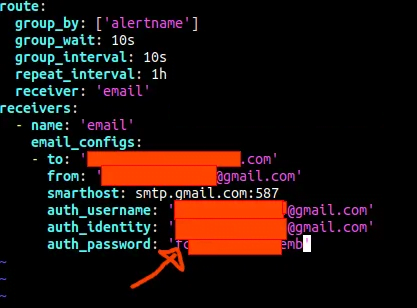
Edit the AlertManager config and provide the app password for your account.
sudo vim /etc/alertmanager/alertmanager.ymlAdd the password by replacing auth_password: ‘google-app-password‘ as shown
Once the changes have been made, restart AlertManager
sudo systemctl restart alertmanager.service#5. Test Email Alert Notification using Alertmanager
To test if Alertmanager is working as desired, we will stop any of the available targets on Prometheus. For example Postgres Exporter.
sudo systemctl stop postgres_exporter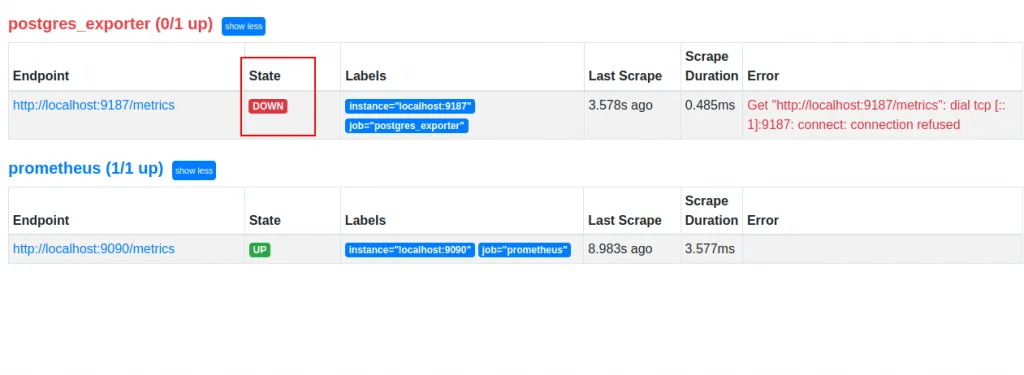
Now navigate to Alerts. You will see status of the alert as active and Pending
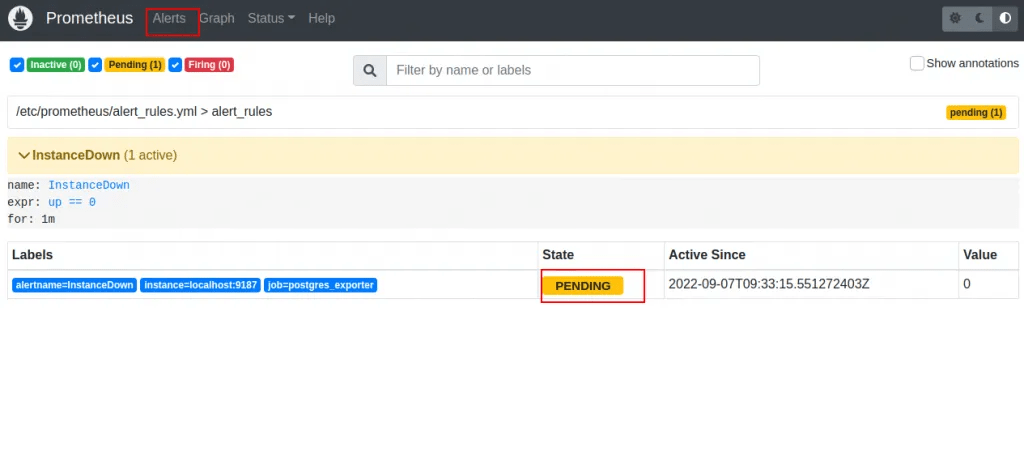
This shows that the alert is about to be sent but still waiting for the time set to elapse. After the set time, the status will change to FIRING

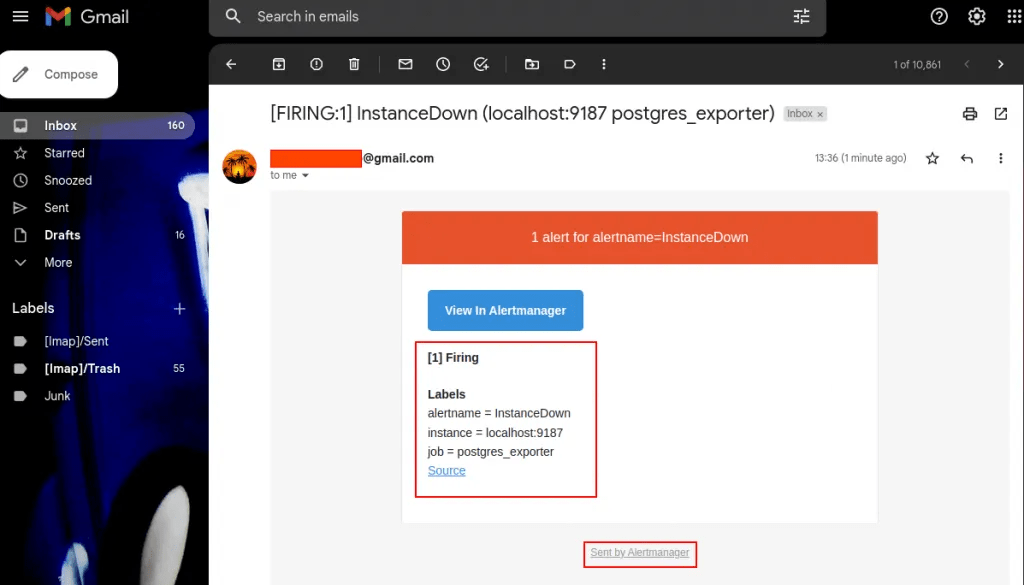
With this state, an alert is sent to AlertManager which is responsible for routing to your email receiver.
You can check the email to see the received notification.
To follow logs and troubleshoot the service, use the command:
$ sudo journalctl --follow --no-pager --boot --unit alertmanager.service
Sep 07 12:42:09 localhost.localdomain alertmanager[93736]: ts=2022-09-07T10:42:09.170Z caller=main.go:232 level=info build_context="(go=go1.17.8, user=root@265f14f5c6fc, date=20220325-09:31:33)"
Sep 07 12:42:09 localhost.localdomain alertmanager[93736]: ts=2022-09-07T10:42:09.171Z caller=cluster.go:185 level=info component=cluster msg="setting advertise address explicitly" addr=192.168.205.12 port=9094
Sep 07 12:42:09 localhost.localdomain alertmanager[93736]: ts=2022-09-07T10:42:09.181Z caller=cluster.go:680 level=info component=cluster msg="Waiting for gossip to settle..." interval=2s
Sep 07 12:42:09 localhost.localdomain alertmanager[93736]: ts=2022-09-07T10:42:09.202Z caller=coordinator.go:113 level=info component=configuration msg="Loading configuration file" file=/etc/alertmanager/alertmanager.yml
Sep 07 12:42:09 localhost.localdomain alertmanager[93736]: ts=2022-09-07T10:42:09.202Z caller=coordinator.go:126 level=info component=configuration msg="Completed loading of configuration file" file=/etc/alertmanager/alertmanager.yml
Sep 07 12:42:09 localhost.localdomain alertmanager[93736]: ts=2022-09-07T10:42:09.204Z caller=main.go:431 level=info component=configuration msg="skipping creation of receiver not referenced by any route" receiver=web.hook
Sep 07 12:42:09 localhost.localdomain alertmanager[93736]: ts=2022-09-07T10:42:09.204Z caller=main.go:535 level=info msg=Listening address=:9093
Sep 07 12:42:09 localhost.localdomain alertmanager[93736]: ts=2022-09-07T10:42:09.204Z caller=tls_config.go:195 level=info msg="TLS is disabled." http2=false
Sep 07 12:42:11 localhost.localdomain alertmanager[93736]: ts=2022-09-07T10:42:11.181Z caller=cluster.go:705 level=info component=cluster msg="gossip not settled" polls=0 before=0 now=1 elapsed=2.000046363s
Sep 07 12:42:19 localhost.localdomain alertmanager[93736]: ts=2022-09-07T10:42:19.183Z caller=cluster.go:697 level=info component=cluster msg="gossip settled; proceeding" elapsed=10.001985143s
.....
Verdict
We have triumphantly walked through how to configure Prometheus Email Alert Notification using Alertmanager. Depending on the set alerts, you will be able to receive notifications on time straight into your Gmail account. I hope this was significant to you.